.png)
.png)
The 2026 Guide to KPIs: Which Business Metrics Actually Matter?
Most businesses do not suffer from a lack of data. They suffer from too much data, too many dashboards and too little agreement on what the numbers mean.
By 2026, that problem is sharper. AI tools can summarize reports in seconds. Cloud platforms can collect events from almost every customer, product and operational touchpoint. Yet none of that guarantees better decisions. A company can track thousands of data points and still miss the few signals that matter.
Good KPI selection and performance metrics start with a simple question: which data helps people make better decisions, faster and with more confidence?
This guide explains how to choose useful KPIs, separate meaningful metrics from noise and build a performance measurement system that still works as data, AI, privacy rules and business models keep changing.

KPI vs. Metric: What’s the Difference and Why Does It Matter?
A metric is any measurement. A KPI is a measurement tied to a key business outcome.
That difference matters. Website visits, shipment counts, customer calls, machine downtime and employee turnover are all metrics. They become KPIs only when they connect directly to a goal that leadership, teams and operators actively manage.
For example:
Business goal | Possible KPI | Supporting metrics |
Improve customer retention | Monthly churn rate | Support response time, product usage frequency, renewal feedback |
Increase order reliability | On-time delivery rate | Picking errors, carrier delays, stock availability |
Grow profitable revenue | Gross margin by customer segment | Discount rate, return rate, cost to serve |
Improve hiring quality | New-hire retention after six months | Time to fill, candidate acceptance rate, manager satisfaction |
A useful KPI has a decision attached to it. If the number changes, someone knows what to review, who should act and which trade-offs to discuss.
A weak KPI only creates attention. A strong KPI creates choice.
5 Signs Your Business Data Is Actually Useful
Useful data is not the same as available data. It is not the same as detailed data. The most valuable data usually meets five tests.
It connects to a real decision
A number is useful when it helps answer a decision question, such as:
Should the business invest more in this product line?
Is service quality improving or getting worse?
Are customers receiving orders when promised?
Which process is causing margin loss?
Where is demand changing faster than supply?
If no one can name the decision, the metric may still be interesting, but it is not a priority.
It is trusted by the people who use it
Trust does not mean perfection. It means users understand where the data comes from, how it is calculated and what its limits are.
In 2026, this is more important because AI tools can produce polished summaries from weak or conflicting data. A clean narrative built on messy inputs can mislead a team quickly.
Trusted data needs:
A clear owner
A documented definition
Known source systems
Update timing
Quality checks
A record of major calculation changes
It is timely enough to act on
Some KPIs need daily or hourly updates. Others work well monthly or quarterly. The right timing depends on the decision.
A warehouse team may need near real-time picking accuracy. A board may only need quarterly cash conversion trends. Faster is not always better. If a number updates more often than the business can respond, it can create noise.
It shows direction, not just status
A single number can hide the real story. Trend, comparison and context usually matter more than the latest value.
For example, a customer satisfaction score of 82 means little on its own. It becomes useful when compared with:
Last quarter
Target range
Similar customer groups
Product version
Service channel
Renewal behavior
Good performance reporting shows whether the business is improving, slipping, or trading one outcome for another.
It can be explained in plain language
If a KPI requires a long technical explanation every time it appears, it may not be ready for wider use.
A good definition should answer:
What does this measure?
Why does it matter?
What is included?
What is excluded?
How often is it updated?
Who owns it?
Plain language does not make data less serious. It makes it more usable.
How to Choose the Right KPIs: A Simple 5-Step Framework
The safest way to choose KPIs is to start with outcomes, then work backward to measurement. This prevents teams from promoting a metric only because it is easy to collect.
1. Name the business outcome
Start with a clear result. Avoid vague goals such as “be more efficient” or “improve customer experience.” Use specific outcomes.
Better examples include:
Reduce repeat customer complaints
Increase gross margin in a specific product category
Improve first-time delivery success
Shorten the time from order to cash
Reduce avoidable employee turnover
The outcome should be important enough that leaders, managers and frontline teams all care about it in different ways.
2. Identify the behavior or process that drives it
KPIs should connect to controllable drivers. If a team cannot influence a number, it may be useful for context, but poor for performance management.
For example, total revenue may be a company KPI. A fulfilment team may need a KPI tied to shipment accuracy, delivery promise reliability, or returns caused by packing errors.
Good KPI design separates:
Outcome indicators
These show the end result, such as revenue growth, churn, or profit margin.
Driver indicators
These show the activities or conditions that influence the result, such as product usage, service response time, or defect rate.
Both matter. Outcome indicators confirm whether the business is winning. Driver indicators help show what to change.
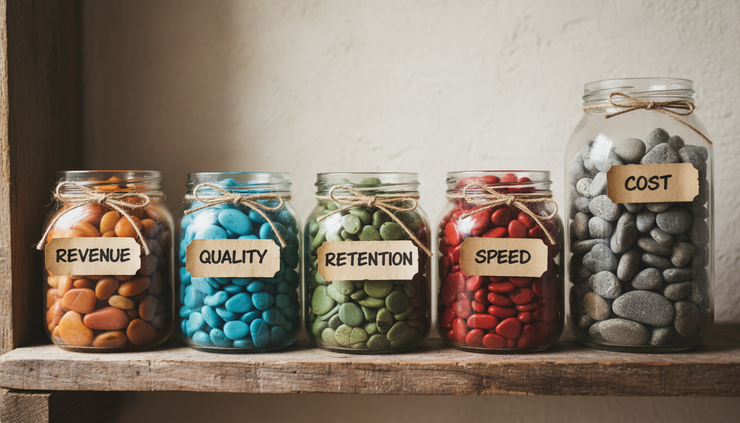
3. Choose a balanced set
A single KPI can drive bad behavior if it is used alone. Speed without quality creates errors. Growth without margin creates waste. Cost reduction without customer impact can damage retention.
A balanced KPI set often includes:
Financial performance
Customer outcomes
Operational quality
Speed or cycle time
Risk and compliance
People and capacity
The goal is not to track everything. The goal is to prevent a narrow measure from hiding damage elsewhere.
4. Define the calculation before publishing the number
Many KPI disputes come from unclear formulas. A sales team and finance team may both discuss “revenue” while using different timing, discounts, refunds, or currency treatment.
Before a KPI appears in a dashboard, define:
Definition item | What to decide |
Formula | Exact calculation and units |
Source | System or dataset of record |
Frequency | Daily, weekly, monthly, quarterly |
Owner | Person or team responsible for the definition |
Thresholds | Green, yellow, and red ranges, if useful |
Segments | Region, product, customer type, channel, or other cuts |
Limits | Known gaps, exclusions, or data delays |
This step may feel slow, but it prevents months of confusion later.
5. Test the KPI with real users
A KPI should make sense to the people who will use it.
Ask a small group to review sample results and explain what they would do if the number rose, fell, or stayed flat. If each person gives a different interpretation, the KPI needs more work.
Good test questions include:
What decision does this support?
What action would this trigger?
Could this number be gamed?
What other metric should sit beside it?
Does the data arrive in time to matter?
Is the definition clear enough?
What’s Changing About KPIs in 2026?
The basics of measurement have not changed, but the environment has. Several 2026 realities should shape how businesses choose and manage KPIs.
AI makes bad metrics spread faster
AI can summarize dashboards, flag anomalies, draft reports and answer natural-language questions. That can save time. It can also spread weak definitions across the business.
If two departments define “active customer” differently, an AI assistant may not know which one to use unless the organization has approved definitions and metadata.
For 2026, every important KPI should have a human-owned definition and a clear source. AI can help explain and monitor the number, but it should not silently invent the rule.
Privacy and consent shape usable data
Businesses increasingly need to manage customer data with care. Consent, retention rules and regional privacy expectations affect what can be collected and how it can be used.
That means useful data must be lawful, appropriate and necessary. A metric that depends on questionable tracking is a risk, even if it looks valuable.
A practical test is simple: can the business explain why it collects the data, how it supports the customer or operation and how long it keeps it?
First-party data matters more
As third-party identifiers become less reliable in many channels, businesses need stronger first-party data. That includes data from direct customer relationships, transactions, product use, service interactions and owned platforms.
For KPI design, this means teams should focus on data they can define, govern and improve over time. Rented or inconsistent external data can still support analysis, but it should rarely form the core of a key performance measure.
Metric governance becomes a business habit
KPI ownership can no longer sit only with analysts. Business leaders, data teams, finance, operations and compliance all have a role.
A healthy 2026 KPI system often includes:
A shared metric catalogue
Approved definitions for key measures
Named owners
Data quality checks
Change history
Clear access rules
Regular review cycles
This does not need to be heavy. Even a simple shared register can reduce confusion if people use it consistently.

Weak vs. Strong KPIs: Real-World Examples
A metric can look sensible and still fail. The difference often comes down to whether it guides the right behavior.
Weak metric | Why it falls short | Better version |
Total customer complaints | Larger customer bases naturally have more complaints | Complaints per 1,000 orders, grouped by issue type |
Average delivery time | Hides late outliers and regional issues | Percentage of orders delivered within promise window |
Total sales | Ignores profit, returns, and discounting | Net revenue with gross margin by segment |
Number of support tickets closed | Rewards speed over resolution quality | First-contact resolution and customer follow-up rating |
Employee training hours | Measures attendance, not skill use | Skill assessment pass rate and on-the-job performance change |
The better version is not always more complex. Often, it is simply closer to the business outcome.
7 KPI Mistakes That Can Lead Your Business in the Wrong Direction
Some measurement problems repeat across industries. Fixing them can improve reporting faster than adding new software.
Tracking too many KPIs
If everything is a KPI, nothing is. A leadership team may need fewer than 10 top-level KPIs, with supporting metrics underneath. A department may have its own focused set.
The key is hierarchy. Not every metric deserves the same level of attention.
Using averages that hide risk
Averages can hide extreme cases. Delivery time, customer wait time, repair time and order value often need distribution views.
For example, average delivery time may look acceptable while a small but valuable customer group sees repeated delays. Percentiles, ranges and segment views often reveal more.
Rewarding behavior that harms the business
People respond to measurement. If a call center is judged only on call length, agents may rush customers. If a sales team is judged only on bookings, it may discount too much or sell poor-fit deals.
Every KPI should be checked for side effects.
Ignoring data quality
A dashboard does not fix unreliable source data. Before relying on a KPI, check common issues:
Duplicate records
Missing values
Late entries
Manual overrides
Inconsistent categories
Time zone mismatches
Currency conversion gaps
Changes in source system rules
Poor data quality should not block every decision, but it should be visible.
How to Build a KPI Dashboard That Actually Helps You Decide
A simple KPI set can be built in a few working sessions.
Start with the business strategy. Choose three to five priority outcomes for the year. For each outcome, name one top KPI and two to four supporting metrics.
Then create a definition sheet for each KPI. Keep it short enough that people will read it. Include the formula, source, owner, timing and known limits.
Next, review whether the set is balanced. Look for missing counterweights. If the business tracks sales growth, it may also need gross margin, retention, or fulfilment quality.
After that, test the KPIs with real data. Use past periods and ask whether the numbers match what people know happened. If the KPI tells a different story, find out why. The KPI may be revealing something useful, or the definition may be wrong.
Set a review rhythm. Monthly works for many operating KPIs. Quarterly works for strategic KPIs. During review, ask:
Did this KPI support a decision?
Did anyone act because of it?
Was the data trusted?
Did it arrive on time?
Should the definition change?
Should the KPI be retired?
Retiring stale metrics is a sign of a healthy measurement system.

Free KPI Scorecard: Is This Metric Worth Tracking?
Use this template to judge whether a KPI deserves attention.
Question | Strong answer |
What outcome does it support? | A named business result |
Who owns it? | A specific person or team |
What decision does it guide? | A real recurring decision |
How is it calculated? | A clear formula |
Where does the data come from? | An approved source |
How often is it updated? | A timing that matches the decision |
What behaviour could it create? | Known and managed side effects |
What sits beside it? | A counter-metric or supporting view |
When will it be reviewed? | A set review date or cycle |
A KPI that fails several of these questions is not ready to guide performance.
The Bottom Line: Better Data Starts With Better Questions
The best performance measurement systems are not the ones with the most data. They are the ones that help people see what matters, agree on what the numbers mean and act before problems become expensive.
For 2026, useful business data should be decision-ready, trusted, timely, clearly defined and governed well enough for both people and AI tools to use safely.
Start small. Pick one important outcome, define the few measures that truly explain it and remove the rest from the main view. Better decisions rarely come from more numbers. They come from better questions and cleaner signals.


.png)
Comments